Introduction
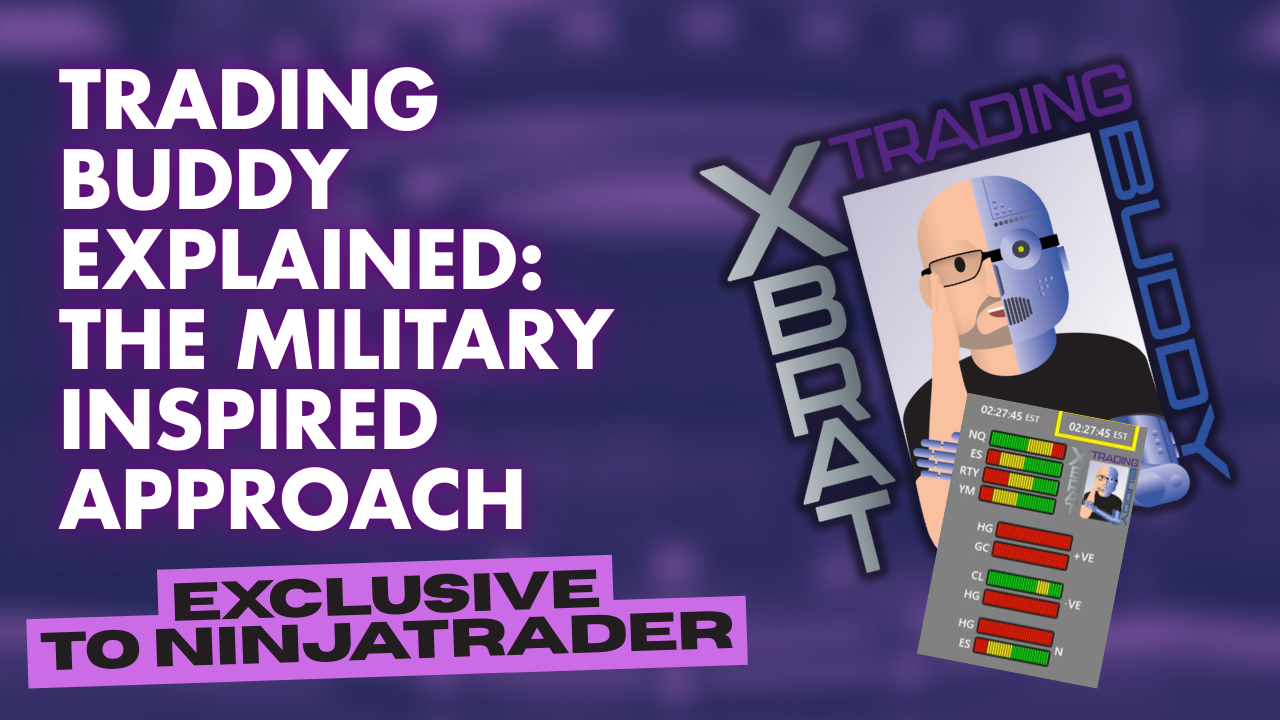
Get ready to revolutionize how you view the markets! In this video, Paul reveals the military-inspired trading strategy behind the xBrat Trading Buddy, helping traders like you navigate the “operational landscape” of the market with confidence and precision.
From decoding market sentiment to leveraging economic calendars, Trading Buddy is your ultimate companion for smarter, more informed trading. And don’t miss the real-life examples where Paul combines cutting-edge tools to demonstrate how you can dominate the charts.
From real-time correlation analysis to insights on market behavior, this tool offers everything you need to trade smarter, not harder. Whether you’re a seasoned pro or just stepping into the trading world, Trading Buddy is your ultimate companion for making confident, informed decisions. 🏆📈
Introducing The xBrat Trading Buddy
The Trading Buddy is more than just a tool—it’s your ultimate trading companion. By combining real-time data analysis, economic calendar integrations, and market correlation insights, it ensures you’re always a step ahead. Let’s break down its key components:
Real-Time Correlation Meters
One of Trading Buddy’s standout features is its correlation meters, which track the alignment of major instruments such as NQ, ES, RTY, and YM. These fixed correlations allow you to gauge overall market sentiment and identify whether markets are moving in synergy or experiencing sector rotation.
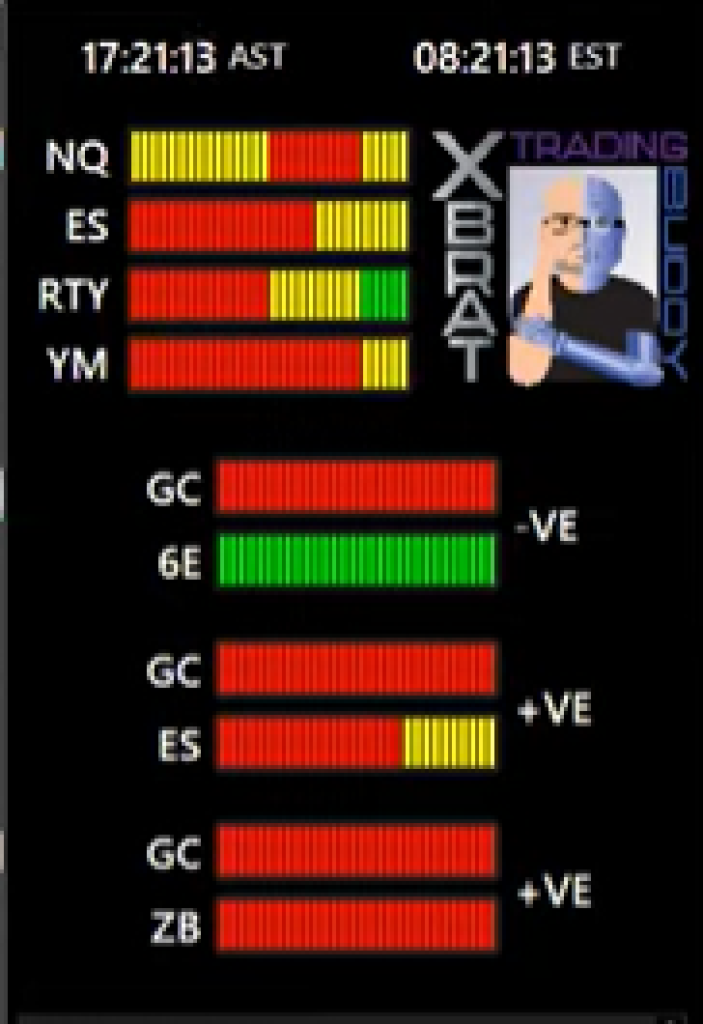
Customizable pairs like HG & GC or CL & HG enable traders to focus on specific instruments. For instance, identifying a positive correlation between copper and gold can validate your short signals, ensuring confident trades.
Live Economic Calendar
Trading Buddy integrates a live economic calendar, highlighting medium to high-impact data points in real-time. This feature enables you to:
- Plan trades around significant economic events.
- Analyze historical reactions to similar data points.
- Identify patterns that influence your instruments.
The calendar’s seamless synchronization with charts ensures that you’re always informed, with data points visually marked for quick reference.
Behavioral Analysis
Trading Buddy empowers you to evaluate how your instruments have reacted to past data. By doing so, you can:
- Understand the significance of specific data releases.
- Identify trends and behaviors tied to your chosen instruments.
- Fine-tune your strategy for future trades.
For example, during European mornings, oil and copper often display a negative correlation, which shifts positively after the U.S. oil pit opens. Recognizing these shifts allows for better trade execution.
Access xBrat Trading Products
For more detailed information on the indicators mentioned, check out these resources:
- Trading Buddy: Learn more about this revolutionary tool and its features.
- xBrat Indicators: Explore additional tools for successful trading strategies.
More xBrat Blogs
- Master the Expert Confluence Trading Strategy Bundle 🚀
- 🚀 Meet Ask Logan: Your A.I. Chatbot Trading Expert at xBrat Software Solutions! 💬
Conclusion
The Power of Trading Buddy
The Power of Trading Buddy lies in its ability to simplify complex market dynamics, enabling traders to make informed decisions with confidence. By leveraging its correlation meters, economic calendar, and behavioral insights, you’ll gain a deeper understanding of market trends and improve your trading performance.
For more in-depth learning and practical examples, watch the full video and explore the additional resources provided. Don’t forget to subscribe to our learning portal and become part of the xBrat Teams community for exclusive access to tools and training.
Risk Disclosure
Futures and forex trading contain substantial risk and are not suitable for every investor. Only trade with risk capital. Past performance is not indicative of future results.
Subscribe for More
Stay updated with the latest trading tips and strategies by following xBrat Software Solutions.