Introduction
Welcome to the Basic Guide to Candlesticks, Heiken Ashi, and Uni Renko – your essential resource for understanding how different chart types can enhance your trading strategies. Trading is not just about the numbers; it’s about recognizing patterns and trends. This is where selecting the right chart type plays a critical role.
Whether you’re a seasoned trader or just starting, this Basic Guide to Candlesticks will walk you through three essential chart types: Candlesticks, Heiken Ashi, and Uni Renko. Each chart offers unique advantages and serves specific purposes, allowing traders to adapt to various market conditions. By the end of this guide, you’ll understand how to use these charts to optimize your strategies and maximize profitability.
Candlesticks
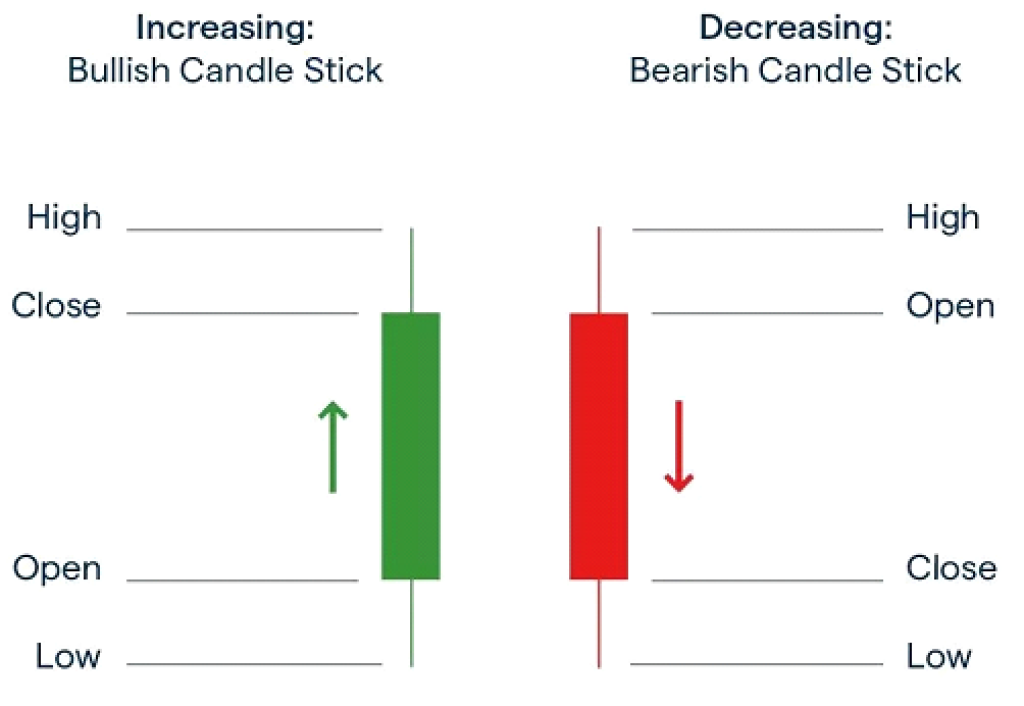
Candlestick charts are the cornerstone of trading analysis, widely favored for their simplicity and ability to provide a detailed view of price action. In this section of the Basic Guide to Candlesticks, we’ll explore how these charts represent price data and why they remain a go-to option for many traders.
Figure 1: Annotated candlestick chart type
How Candlesticks Work
Each candlestick represents the open, high, low, and close prices for a specified timeframe.
- Body: Shows the opening and closing prices.
- Wicks (Shadows): Represent the highest and lowest prices during the period.
For instance, a green candle (bullish) indicates the price closed higher than it opened, while a red candle (bearish) indicates the opposite.
Patterns and Applications
Candlesticks provide more than just price data; they reveal market sentiment and momentum through patterns like Doji, Hammer, and Engulfing. Tools like our Free Volume Behaviour Trading Indicator enhance these insights, helping traders determine if trends have the strength to reverse.
As detailed in this Basic Guide to Candlesticks, these charts are ideal for strategies requiring precise price levels, such as the xBrat Range Breakout. This strategy relies on candlesticks to define high and low extremes during opening ranges.

Figure 2: Candlestick patterns
Limitations of Candlesticks
Despite their versatility, candlestick charts can generate “noise” in volatile markets, making it harder to identify significant trends. This is a key consideration when choosing the best chart type for your strategy.
Heiken Ashi
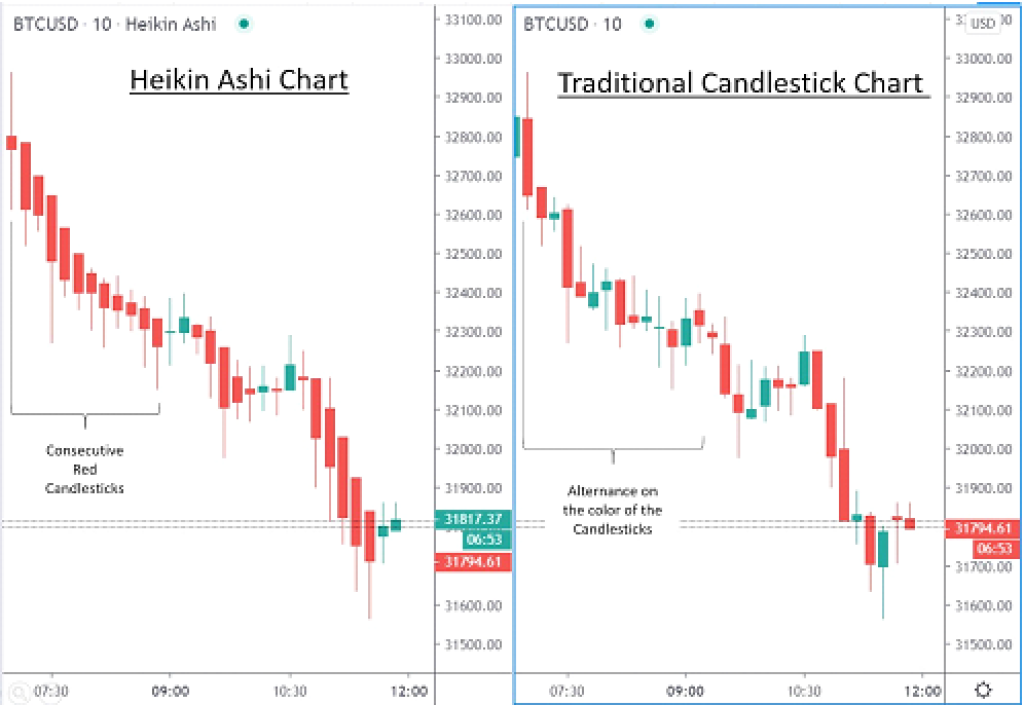
In this Basic Guide to Candlesticks, we move beyond traditional candlesticks to explore the Heiken Ashi chart. This chart type smooths out price action by using averaged values, offering a clearer view of trends.
Figure 3: A comparison of Heiken Ashi and candlestick chart types
How Heiken Ashi Works
Heiken Ashi charts calculate price data based on averages from previous candles. This reduces “noise” and creates a smoother chart, making it easier to identify trends or reversals.
Benefits of Heiken Ashi
- Highlights strong trends by filtering out minor fluctuations.
- Reduces distractions from unnecessary market noise.
- Perfectly complements xBrat strategies like Rollercoaster, Algo, Slingshot, and VWAP Predator.
Limitations of Heiken Ashi
While Heiken Ashi charts excel in trend identification, their reliance on averages may delay signals. Additionally, they do not display precise price points, which can be a disadvantage for scalping or high-frequency trading.
Uni Renko
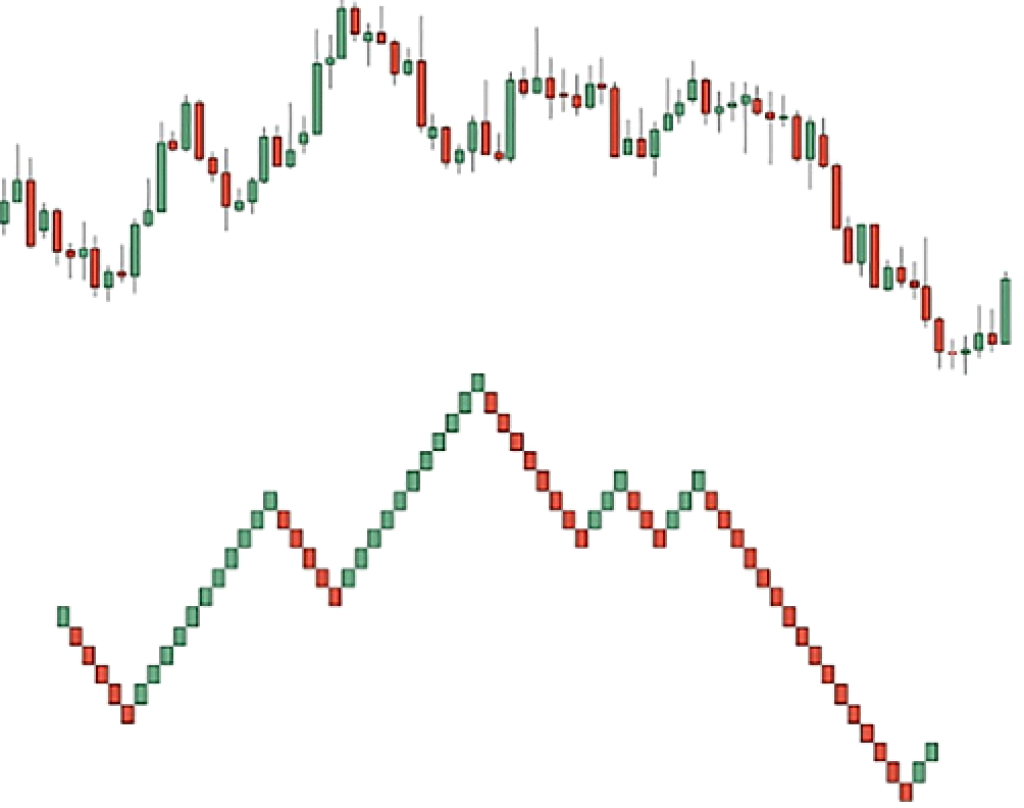
The final section of our Basic Guide to Candlesticks introduces Uni Renko, a unique chart type that focuses exclusively on price movement. Unlike candlesticks and Heiken Ashi, Uni Renko completely ignores time, offering a fresh perspective on trends.
Figure 4: Comparison of candlestick and Renko chart types
How Uni Renko Works
Uni Renko charts use “bricks” to represent price movements. Traders can customize settings such as:
- Tick Trend: Determines the size of each brick based on price movement.
- Open Offset: Adds a buffer zone to validate trends before forming a new brick.
- Tick Reversal: Specifies how much price must move in the opposite direction to indicate a trend reversal.
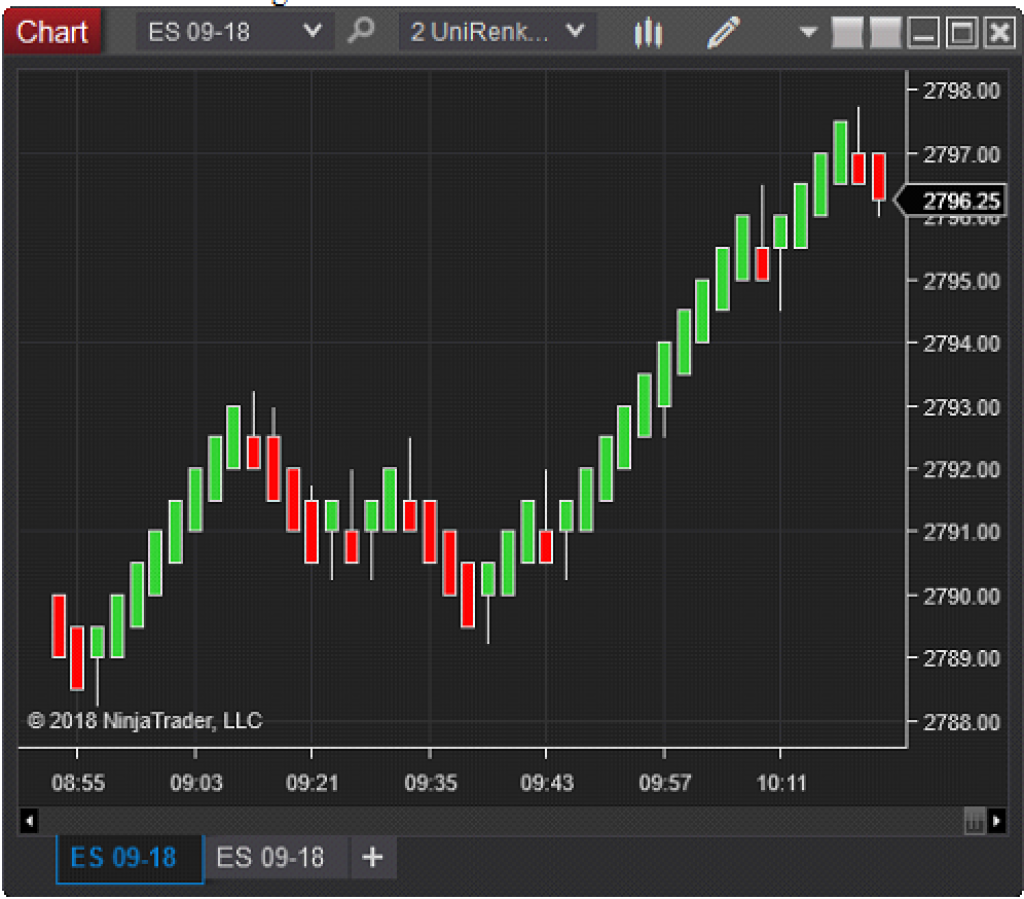
For example, the common “233 Uni Renko” setting uses a tick trend of 2, open offset of 3, and tick reversal of 3. These settings make Uni Renko highly customizable for various assets and strategies.
Figure 5: Uni Renko chart type
Benefits of Uni Renko
- Filters out small price movements entirely, focusing on major trends.
- Highlights trend reversals with precision.
- Complements advanced xBrat strategies like Rollercoaster, Algo, Slingshot, and VWAP Predator.
Limitations of Uni Renko
While Uni Renko excels at trend analysis, its lack of time consideration may misrepresent recent price activity. Optimizing settings for different assets can also require extra effort.
Conclusion
This Basic Guide to Candlesticks has highlighted the unique features and applications of Candlesticks, Heiken Ashi, and Uni Renko charts:
- Candlesticks offer detailed real-time data for precise analysis.
- Heiken Ashi smooths out noise, making it ideal for identifying strong trends.
- Uni Renko eliminates minor fluctuations, focusing solely on significant price movements.
Each chart type serves a specific purpose and pairs perfectly with the right xBrat strategy. By mastering these charting methods, traders can gain deeper insights into market trends and make more informed trading decisions.
Start applying the lessons from this Basic Guide to Candlesticks today, and take your trading to the next level! 🎯
See More Blogs From xBrat Software Solutions
Automated Trading Wins! $1,645 Profit in Hours Using ASBs on Gold 💸
The xBrat Mantra – Signal, Confirmation & Fresh Air