Introduction
🚀 Ready to take your trading game to the next level? If you’re tired of guesswork and want a proven system to navigate the markets with precision, The xBrat Trading Buddy is here to transform your strategy. 🌟 Inspired by military tactics, this powerful tool helps traders decode the “operational landscape” of the market—from spotting correlations to timing economic data for maximum impact.
In this blog, we’ll unpack the secrets behind The xBrat Trading Buddy, including its cutting-edge features, actionable insights, and how it integrates seamlessly with other top-tier indicators. Whether you’re a seasoned pro or just starting out, this guide will show you how to harness the full power of The xBrat Trading Buddy. 💼📊
Understanding the Operational Landscape
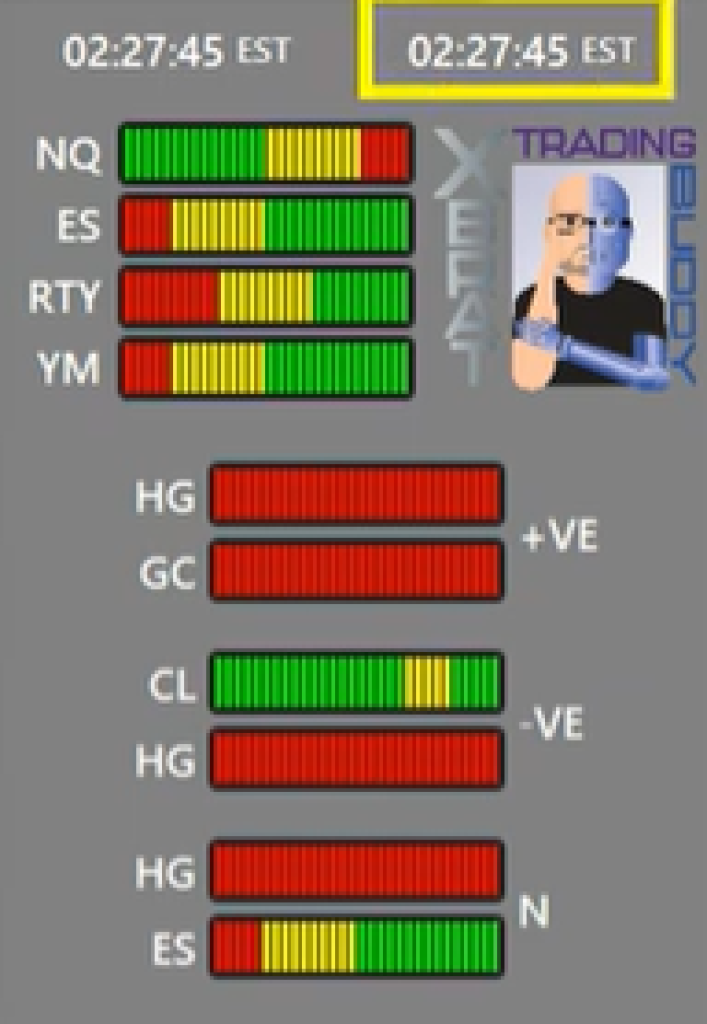
At its core, The xBrat Trading Buddy acts as a navigator for your trading strategy, much like planning a military operation. The concept of an “operational landscape” involves analyzing multiple factors that influence market behavior, such as support and resistance zones, economic data releases, and market sentiment.
Paul explains how mastering this landscape ensures that traders approach the market with confidence and preparedness. By using The xBrat Trading Buddy, you gain access to critical tools like:
- Correlation Meters: These help identify market sentiment by analyzing how indexes or assets interact.
- Economic Calendar Integration: Stay ahead of impactful announcements by aligning your trades with economic events.
- Support and Resistance Zones: Intuitive, multi-timeframe zones help pinpoint decision points on your chart.
- Bias Depth Heatmap: A tool that offers visual confirmation of market bias, helping traders identify trends and reversals with greater accuracy.
Key Features of The xBrat Trading Buddy Interface
The Trading Buddy interface offers a user-friendly design that centralizes everything you need to make informed decisions. Here’s a breakdown of its standout features:
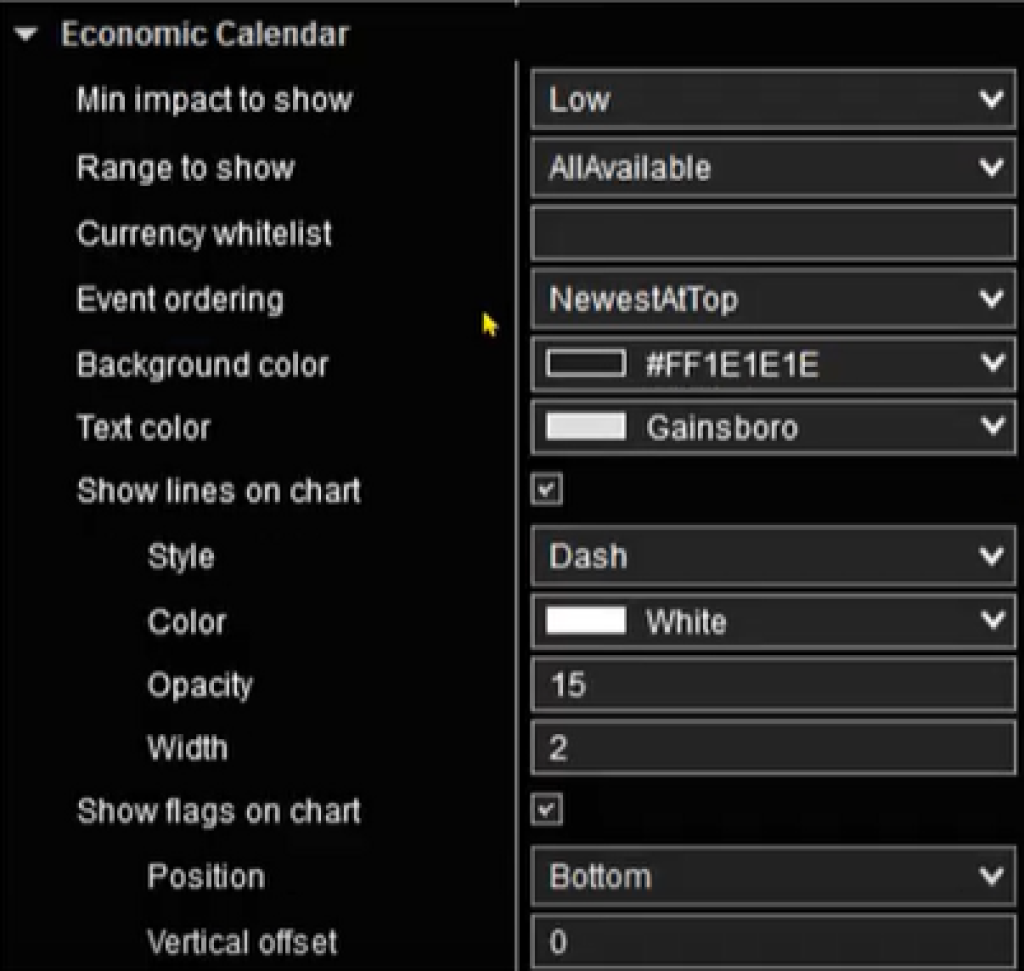
- Fixed and Adjustable Time Zones: Default EST time ensures traders operate in sync with market movements. Additionally, customizable time zones align the economic calendar to your local trading hours.
- Live Economic Calendar: Displayed directly on your charts, this feature keeps you informed about upcoming data releases and their potential impact on the market.
- Correlation Insights: Analyze asset relationships and market trends to anticipate future price movements.
Leveraging Correlation Meters for Better Trades
The correlation meters within The xBrat Trading Buddy are indispensable for understanding market sentiment. Paul demonstrates how:
- A synchronized movement across all major indexes signals broader market trends.
- Mixed signals across indexes highlight potential caution points for traders.
- Positive or negative correlations between assets, such as copper and gold, can increase trade confidence.
Timing Trades Around Economic Data
Paul emphasizes the importance of aligning your trading strategy with economic data releases. By knowing when impactful data will be released, traders can:
- Avoid entering positions during high-volatility periods.
- Manage risks by setting stop-loss or trailing orders ahead of announcements.
- Capitalize on predictable market reactions post-announcement.
Combining Indicators for Strategic Insights
While The xBrat Trading Buddy provides a robust standalone experience, its true power is unlocked when combined with other indicators, such as:
- Range Breakout: Helps identify entry points during high-impact events.
- VWAP Predator: Ideal for momentum-based trading strategies.
- Guardian Zones: Dynamic, multi-timeframe support and resistance zones for precise trade execution.
- Bias Depth Heatmap: Enhances your strategy by visually confirming market bias, helping you make better-informed decisions.
These tools work in harmony to complete your operational landscape, offering signal generation, confirmation, and risk management in one cohesive strategy.
Win More With xBrat
For more detailed information on the indicators mentioned, check out these resources:
- Trading Buddy: Learn more about this tool and how it can enhance your trading strategy.
- xBrat Indicators: Full range of xBrat Trading Indicators.
More xBrat Blogs
- xBrat Christmas Training Weekend Replay
- The Trading Tools You NEED to Master the Markets in 2024 – 2025
Conclusion
The xBrat Trading Buddy is more than just a tool—it’s your guide to mastering the markets. By understanding the operational landscape, leveraging correlations, and timing your trades around economic events, you can approach trading with clarity and confidence.
Combine The xBrat Trading Buddy with complementary tools like Range Breakout, VWAP Predator, Guardian Zones, and the Bias Depth Heatmap to create a well-rounded, high-probability trading strategy. To learn more, watch the full video here and explore the resources linked above.
When you purchase The xBrat Trading Buddy, you’ll gain exclusive access to a learning portal and training course, as well as join an amazing community of traders in xBrat Teams.
Risk Disclosure: Futures and forex trading contain substantial risk and are not suitable for every investor. Only trade with risk capital. Past performance is not indicative of future results.
Subscribe for More: Stay updated with the latest trading tips and strategies by subscribing to the xBrat Software Solutions YouTube Channel.