Introduction
Greetings Everyone! Welcome to xBrat Software Solutions! 🎯 If you’re looking to improve your trading accuracy and make more informed decisions, understanding Volume Behavior is essential. In this comprehensive guide, you’ll learn how to use the color coding of the xBrat Volume Behavior Indicator to better interpret market trends, and how to combine that with key candle patterns like bullish harami and bearish engulfing. By mastering these tools, you’ll gain a deeper understanding of how volume and candle patterns interact to influence the price movements of an asset in the market. 📊
With these insights, you’ll be able to identify key market signals and avoid false entries, significantly improving your trading experience and results. 🚀 Let’s get started and unlock the full potential of the xBrat Volume Behavior Indicator! 💡
What Is Volume Behavior?
At its core, Volume Behavior refers to how buying and selling volume affects price movements in the market. Volume is an essential component when paired with price action analysis, as it provides a more complete picture of market dynamics. By analyzing volume in conjunction with price patterns, traders can identify accumulation (buying) and distribution (selling) phases, allowing for more informed decision-making.
Why Volume Behavior Matters in Trading
Understanding Volume Behavior is crucial because it helps traders:
- Spot market trends early by identifying buying and selling pressures.
- Filter out false signals and avoid entering low-probability trades.
- Confirm price action patterns like bullish and bearish engulfing setups.
In the video, Paul from xBrat Software breaks down how to read accumulation and distribution candles, helping traders gain confidence in identifying market strength or weakness.
Candle Colors: A Key Indicator of Volume Behavior
One of the standout features in the video is the use of candle colors to represent different types of volume behavior:
Red candles signify distribution days, where more sellers dominate the market.
Cyan candles indicate a down candle with less volume, highlighting weak downward momentum.
Green candles show accumulation, signaling that more buyers are stepping in.
Gray candles represent up candles with less volume, showing weak upward momentum.

Avoiding False Signals
False signals can cause traders to enter trades at the wrong time. To avoid this, it’s important to focus on low-volume candles. As shown in the video, candles with long wicks but low volume suggest price rejection, but the lack of volume means the move is not strong enough to trade on.
For example, if you see a spinning top (a reversal pattern) colored gray, this indicates that although the price has rejected the lows, the low volume means there is little momentum to sustain an upward move. Therefore, it’s crucial to avoid jumping into trades based solely on price action without considering volume.
Candle Patterns and Their Role in Volume Behavior
In trading, candle patterns provide valuable insights into market sentiment and future price movement, especially when paired with volume data. Understanding these patterns helps traders identify accumulation and distribution phases, reversals, and trend continuations. Below, we’ll explore some of the key candle patterns discussed in the video and how they interact with volume to enhance trading strategies.
1. Volume Accumulation Candles

Volume accumulation candles occur when there is more buying volume compared to the previous candles. These candles indicate that traders are accumulating positions, often signaling an upward trend. In the video, Paul explains how traders can identify accumulation candles by comparing the volume of consecutive candles—when each successive candle has more volume, it’s a strong indication that buyers are stepping in and momentum is building to the upside. The presence of multiple accumulation candles in a row suggests a bullish trend.
2. Volume Distribution Candles
On the flip side, volume distribution candles represent increased selling pressure. These candles appear when there is more selling volume compared to the previous candles, often signaling a downward trend. In the video, Paul emphasizes how distribution candles are typically more aggressive than accumulation candles, showing a sharper increase in volume as sellers rush to exit their positions. Identifying distribution candles can help traders anticipate a market downturn and prepare to either exit long positions or consider shorting the market.

3. Spinning Top Candles

A spinning top is a candle with a small real body and long wicks on either side, indicating indecision in the market. While spinning tops can signal potential reversals, Paul explains in the video that volume is key to determining their significance. A spinning top with low volume (such as a gray-colored candle in the volume behavior indicator) may suggest weak momentum behind the reversal, making it less reliable as a trading signal. However, if the spinning top is accompanied by high volume, it could be a stronger signal of a potential market shift.
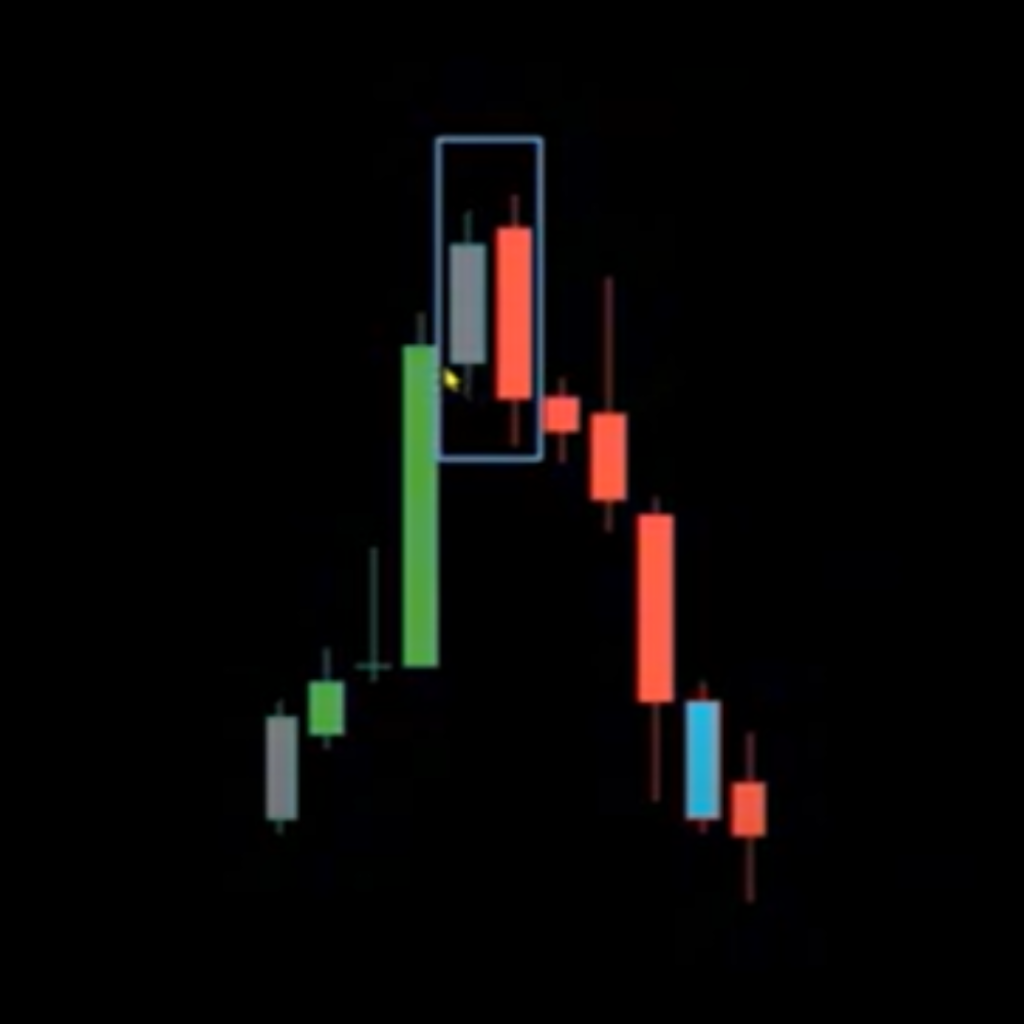
4. Bearish Engulfing Candles
A bearish engulfing candle forms when a large red candle completely engulfs the body of the previous green candle, signaling a strong reversal to the downside. In the video, Paul shows how this pattern is even more powerful when accompanied by higher volume. A bearish engulfing candle with more volume than the previous candle indicates that sellers have overwhelmed buyers, often leading to further downside movement. This pattern is an essential part of the volume distribution analysis, helping traders spot market weakness and exit or short their positions.
5. Bullish Engulfing Candles
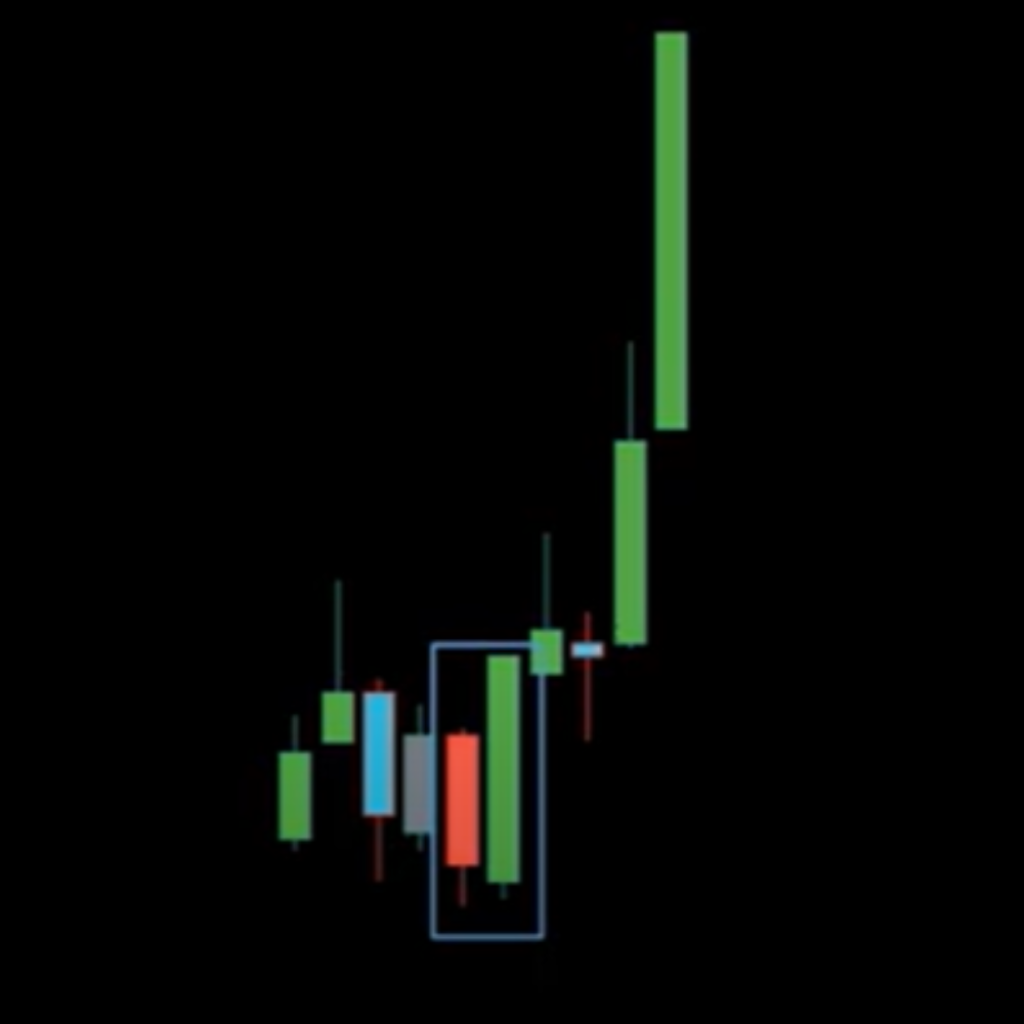
Conversely, a bullish engulfing candle occurs when a large green candle engulfs the body of the previous red candle, signaling a reversal to the upside. Just like its bearish counterpart, the bullish engulfing pattern is more reliable when confirmed by volume. As Paul explains in the video, a green candle with significantly higher volume than the previous red candle indicates that buyers are gaining control, and a potential upward move is likely. This pattern is particularly effective when it follows a series of low-volume down candles (cyan in the indicator), signaling that selling momentum is fading.
6. Doji Candles
A doji candle forms when the open and close prices are nearly identical, resulting in a very small real body. Doji candles reflect market indecision and can signal potential reversals. In the video, Paul discusses how doji candles can be particularly informative when paired with volume data. A doji with high volume may indicate a stronger reversal potential, whereas a doji with low volume suggests that the market is consolidating and may continue in its current direction. Like the spinning top, volume plays a crucial role in determining the strength of the signal.
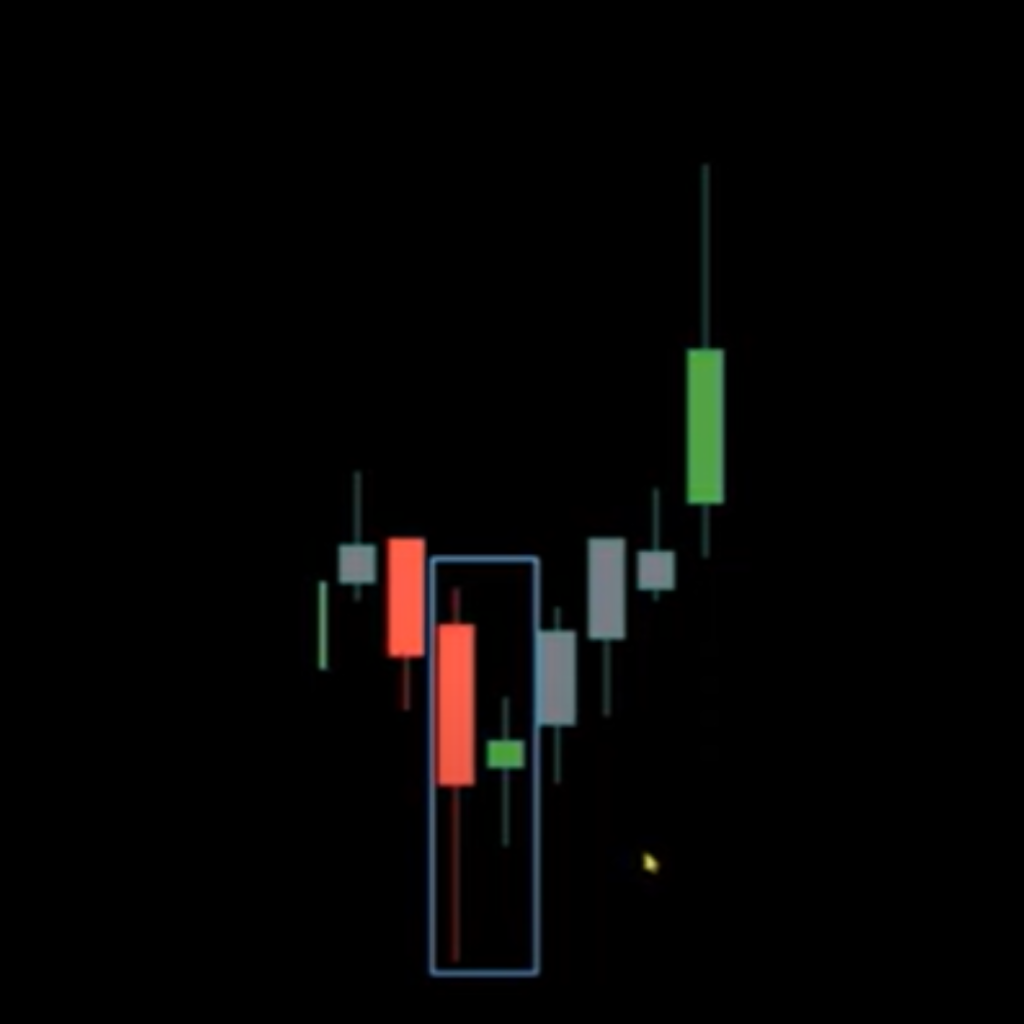
7. Bullish Harami Candles

A bullish harami is a two-candle pattern where a small green candle is contained within the body of the previous large red candle, signaling a potential reversal to the upside. In the video, Paul explains how this pattern, combined with volume analysis, can provide valuable insight into market behavior. A bullish harami with higher volume on the green candle than on the red candle suggests that buyers are starting to regain control, and a reversal is likely. Traders can use this pattern as an entry point for long positions, especially if the volume increases significantly on the second candle.
🔗 More Links
Traders who rely on the Volume Behaviour Indicator also highly value the Bias Depth Heatmap. This powerful tool confirms signals across six different timeframes, providing added confidence in your trades. Get it here
Videos About The Bias Depth Heatmap:
BIAS Depth Heatmap Strategy: Top Trading Tips 📈
Unlock Forex Success with VWAP Predator & Bias Depth Heatmap 📈
Smart Trading Tactics: Signal Confirmation & Fresh Air with VWAP Predator
Conclusion
This blog has served as your ultimate guide to Volume Behavior, packed full of actionable insights and information to elevate your trading strategies. From understanding the critical differences between volume accumulation and distribution candles to analyzing key patterns like bearish engulfing, bullish harami, and spinning tops, we’ve covered everything you need to get started with the xBrat Volume Behavior Indicator.
By now, you should have a strong grasp of how to read volume behavior and integrate it into your price action analysis, enabling you to make more informed and confident trading decisions. Whether you’re using this information to spot early trends, confirm signals, or avoid low-volume traps, this guide has laid the foundation for you to enhance your trading accuracy.
For those who are serious about taking their trading to the next level, the xBrat Volume Behavior Indicator is a powerful tool that provides real-time insight into market momentum and strength. Traders who rely on this indicator also highly value the Bias Depth Heatmap, which confirms signals across multiple timeframes, providing additional confidence in your trades.
If you haven’t already, be sure to check out the Bias Depth Heatmap and see how it can work in synergy with the Volume Behavior Indicator to boost your trading results even further.