Introduction
Looking to level up your trading game? This blog dives into a powerful TradingView Tesla Strategy crafted for post-earnings success. With tools like the Roller Coaster, Slingshot, Bias Depth Heatmap, and The Manager, you’ll uncover how to spot high-probability trades, master risk management, and maximize your returns—all while taking advantage of Tesla’s post-earnings momentum.
Why Post-Earnings Strategies Matter
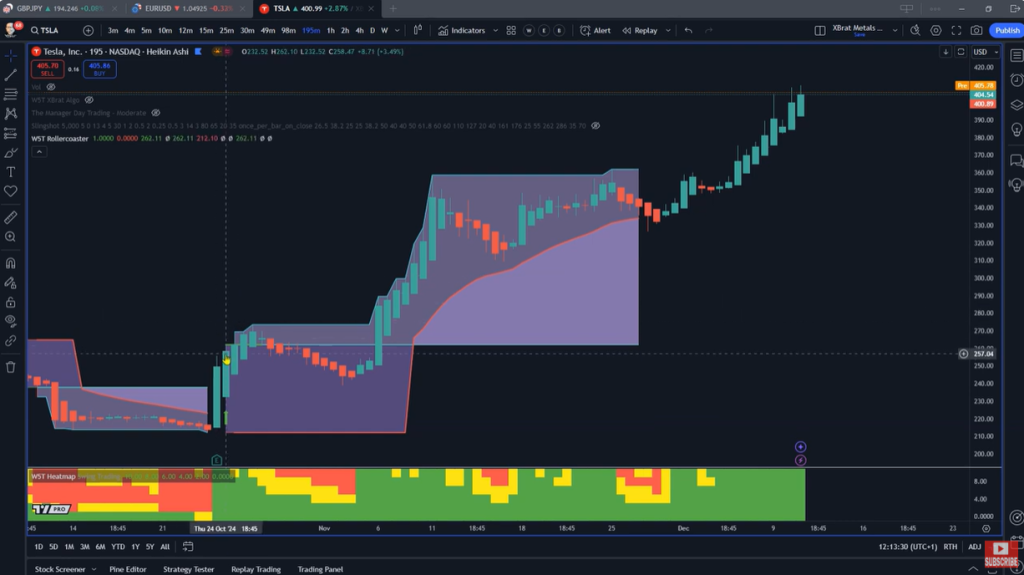
Post-earnings trading offers significant opportunities due to heightened volatility and momentum. Instead of speculating on earnings outcomes, this strategy focuses on reacting to post-earnings market behavior, enabling traders to make informed, low-risk decisions.
Main Content
The 195-Minute Chart: A Key Perspective
The foundation of this strategy is the 195-minute candle on TradingView. This unique timeframe divides the trading day into two equal parts, providing smoother price action and clearer insights into Tesla’s movements. This makes it easier to identify actionable patterns and trends.
Tools and Indicators for Confluence
Roller Coaster Indicator
- Identifies early entry signals after earnings reactions.
- Confirm entries when Tesla’s price breaches the high of the Roller Coaster’s signal candle.
- Learn more and get it here.
xBrat Slingshot Indicator
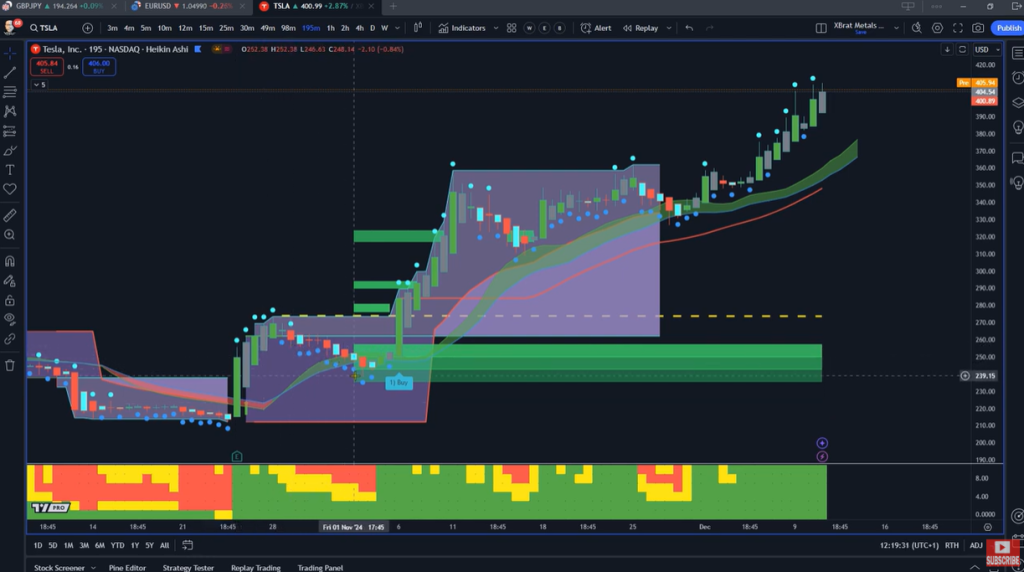
- Pinpoints pullbacks and provides high-probability entry signals.
- For TradingView | For NinjaTrader.
Bias Depth Heatmap
- Confirms trade setups by analyzing sentiment across six timeframes.
- Learn more.
The Manager Indicator
- Validates pullbacks and trend continuations by tracking volume and momentum.
- Confirms whether pullbacks are normal profit-taking or potential reversals.
- Explore here.
Combining Indicators for Confluence
Confluence strategies involve aligning signals from multiple tools to boost trade accuracy:
- The Roller Coaster generates initial entry signals.
- The Slingshot verifies pullbacks and offers secondary entry opportunities.
- The Bias Depth Heatmap ensures sentiment alignment across multiple timeframes.
- The Manager evaluates pullbacks, identifying whether they are part of a healthy trend.
Managing Risk and Maximizing Returns
Risk management is crucial for long-term success. This strategy employs trailing stops and average price calculations to lock in profits and minimize exposure. By strategically adding positions during pullbacks, traders maintained an average entry price of $274, resulting in a 48% return on Tesla holdings.
xBrat Trading Indicators
Explore the tools featured in this strategy:
- Roller Coaster Indicator
- xBrat Slingshot (TradingView)
- xBrat Slingshot (NinjaTrader)
- Bias Depth Heatmap
- The Manager Indicator
- Full Range of Trading Indicators
More xBrat Blogs
Check out these related blogs for deeper insights:
- Stock Swing Trading Made Simple with the Roller Coaster Indicator
- A Complete Guide to Modular Trading Education: The xBrat Academy
Conclusion
A TradingView Tesla Strategy combined with robust trade management techniques can significantly enhance trading performance. By utilizing tools like the Roller Coaster, Slingshot, Bias Depth Heatmap, and The Manager, traders can confidently navigate Tesla’s post-earnings moves and achieve consistent results.
For practical examples and further insights, watch the full video and explore the linked resources. Join xBrat Teams to connect with a thriving trading community and take your trading to the next level.
Risk Disclosure
Futures and forex trading carry significant risk and are not suitable for all investors. Only trade with risk capital. Past performance does not guarantee future results.
Subscribe for More
Stay ahead with the latest trading tips and strategies by subscribing to xBrat Software Solutions on YouTube!